real estate market trends Australia
35 Australian Real Estate Market Statistics for 2026

Key Statistics Summary
- Australian dwelling values increased by 4.9% during 2024, although the national index declined by 0.1% in December, according to CoreLogic's Home Value Index (https://www.corelogic.com.au/news-research/news/2025/australian-home-values-record-first-decline-in-nearly-two-years-as-the-market-finds-a-turning-point).
- Perth recorded the strongest capital-city growth in CoreLogic's 2024 results, with dwelling values rising by 19.1%, followed by Adelaide at 13.1% and Brisbane at 11.2%.
- The total value of Australia's residential dwellings reached $11.0 trillion in the December quarter of 2024, according to the Australian Bureau of Statistics (https://www.abs.gov.au/statistics/economy/price-indexes-and-inflation/total-value-dwellings/latest-release).
- Australia had approximately 11.0 million residential dwellings in the December quarter of 2024, with a national mean dwelling price of about $1.0 million, according to the ABS Total Value of Dwellings release.
- Australia's population reached 27.2 million at 30 June 2024 after annual growth of 2.1%, according to the ABS (https://www.abs.gov.au/statistics/people/population/national-state-and-territory-population/latest-release).
- The 2021 Census found that 31.0% of occupied private dwellings were owned outright, 35.0% were owned with a mortgage and 30.6% were rented, according to the ABS (https://www.abs.gov.au/census/find-census-data/quickstats/2021/AUS).
- Australia's national residential vacancy rate was 1.0% in January 2025, according to SQM Research (https://sqmresearch.com.au/graph_vacancy.php).
- Housing Australia projected that approximately 938,000 new homes would be delivered during the National Housing Accord period, compared with the national target of 1.2 million homes, in its State of the Nation's Housing 2024 report (https://www.housingaustralia.gov.au/research-data-analytics/state-nations-housing-report-2024).
Introduction
Australian property conditions entering 2026 reflect several overlapping forces: uneven capital-city price growth, low rental availability, high construction costs, population growth and a housing supply pipeline that remains below government ambitions. These real estate market trends Australia-wide matter because national averages can conceal substantial differences between cities, suburbs, dwelling types and property sectors.
This reference article is intended for property owners, buyers, investors, analysts, journalists and practitioners evaluating the Australian property market outlook. It consolidates publicly available information from the ABS, Reserve Bank of Australia, Housing Australia, CoreLogic, PropTrack, SQM Research, the Australian Taxation Office and other established sources. Because complete 2026 market data does not yet exist, the report uses the latest verifiable releases available for the 2026 planning environment. It distinguishes recorded results from forecasts and does not treat a national average as a substitute for local due diligence.
Readers examining property services can consult the site's real estate information, while the separate property finance information provides context on finance-related considerations. These links do not replace independent legal, financial, tax or valuation advice.
Residential Property Prices and Market Direction
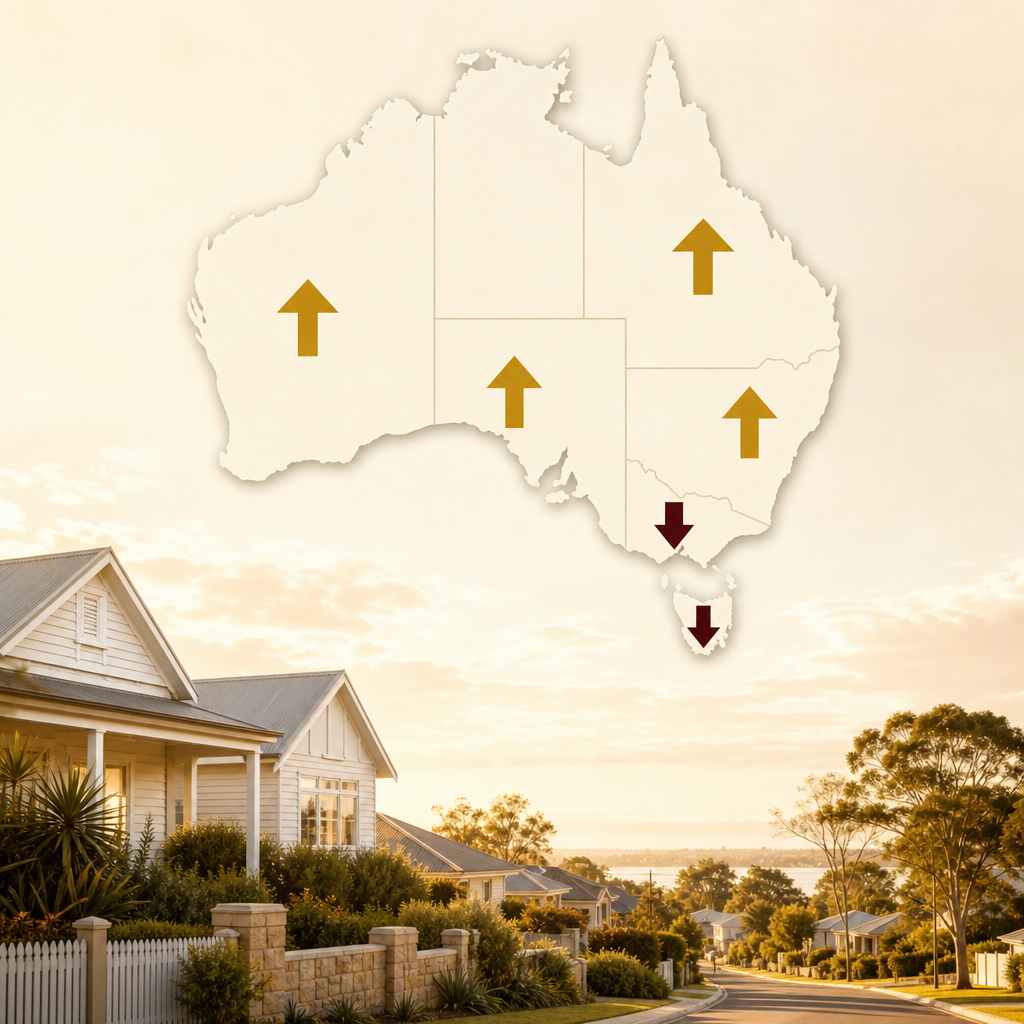
Australia's residential market did not move uniformly during 2024. CoreLogic's national index rose across the year, but momentum weakened toward year-end and several capitals recorded annual declines.
- According to CoreLogic (https://www.corelogic.com.au/news-research/news/2025/australian-home-values-record-first-decline-in-nearly-two-years-as-the-market-finds-a-turning-point), national dwelling values increased by 4.9% over 2024.
- According to the same CoreLogic release, the national Home Value Index fell by 0.1% in December 2024. This was the first monthly national decline in almost two years.
- CoreLogic reported that Perth dwelling values increased by 19.1% during 2024, making it the strongest-performing capital in its annual index.
- CoreLogic recorded annual increases of 13.1% in Adelaide and 11.2% in Brisbane during 2024.
- CoreLogic reported a 3.0% annual decline in Melbourne dwelling values during 2024. Hobart and Canberra also finished the year below their respective levels at the beginning of the year.
- PropTrack's separate Home Price Index reported national price growth of 4.73% during 2024, illustrating how index construction and data coverage can produce modestly different results (https://www.proptrack.com.au/insights-hub/home-price-index/).
The following table presents CoreLogic's recorded capital-city movements. Each figure comes from the same annual Home Value Index release, rather than combining incompatible measures from different providers.
| Capital city | Change in dwelling values during 2024 | Source |
|---|---|---|
| Sydney | 2.3% | CoreLogic Home Value Index, January 2025 release |
| Melbourne | -3.0% | CoreLogic Home Value Index, January 2025 release |
| Brisbane | 11.2% | CoreLogic Home Value Index, January 2025 release |
| Adelaide | 13.1% | CoreLogic Home Value Index, January 2025 release |
| Perth | 19.1% | CoreLogic Home Value Index, January 2025 release |
| Hobart | -0.6% | CoreLogic Home Value Index, January 2025 release |
| Darwin | 0.8% | CoreLogic Home Value Index, January 2025 release |
| Canberra | -0.5% | CoreLogic Home Value Index, January 2025 release |
Source: CoreLogic, Australian home values record first decline in nearly two years.
These results show why a property forecast Australia-wide should not be interpreted as a forecast for every city. Perth, Adelaide and Brisbane entered the latest cycle with different affordability, migration and supply conditions from Sydney and Melbourne. Within each capital, results can diverge further by suburb, price bracket and property type.
The PropTrack and CoreLogic figures are not contradictory. Each organisation uses its own dataset, revision process, geographic coverage and index methodology. A sound market assessment should remain internally consistent by comparing results from the same index over time.
Housing Stock, Population and New Supply
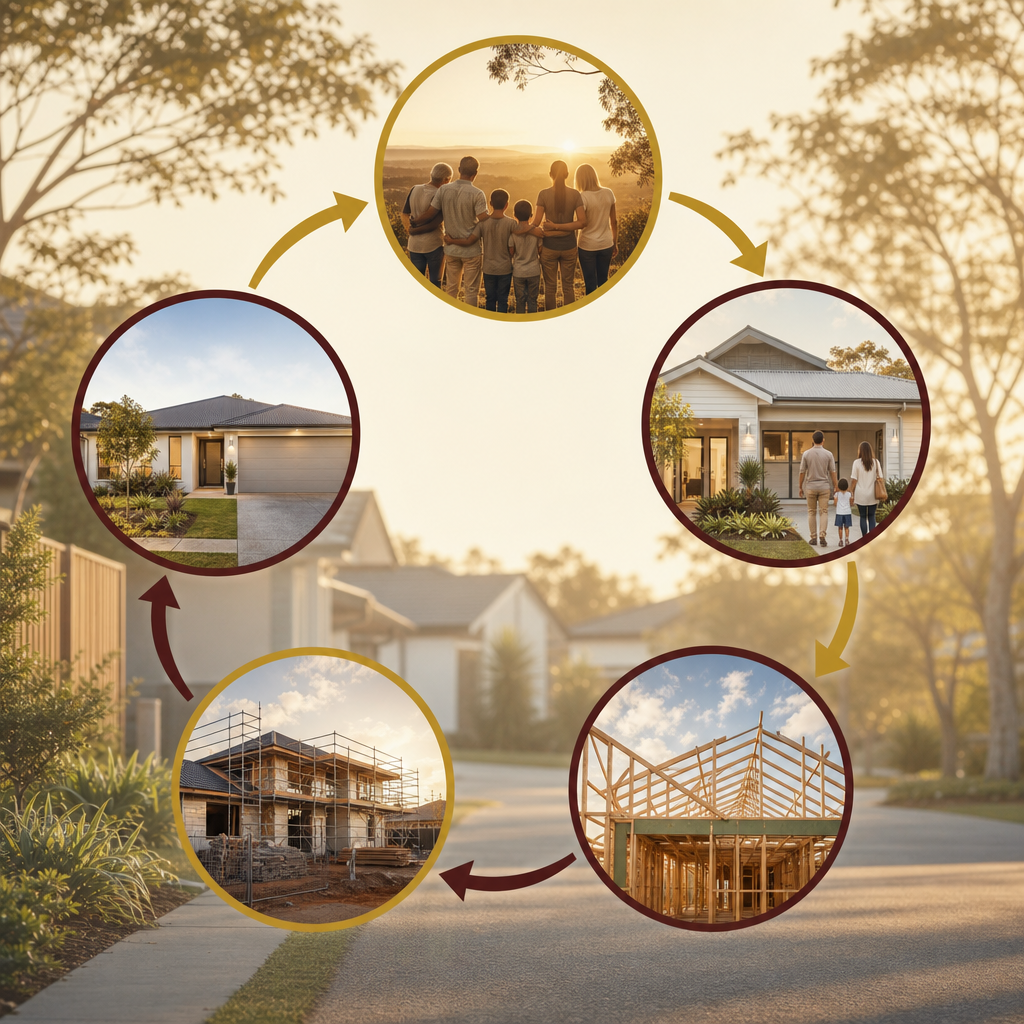
Housing demand is influenced by household formation, migration and population distribution, while available supply depends on planning, approvals, construction capacity and project feasibility. Population growth does not translate mechanically into an equivalent number of required dwellings, but it is a central component of demand analysis.
- According to the ABS (https://www.abs.gov.au/statistics/people/population/national-state-and-territory-population/latest-release), Australia's population reached 27.2 million at 30 June 2024.
- The ABS reported annual population growth of 2.1%, equivalent to an increase of approximately 552,000 people in the year to 30 June 2024.
- According to the ABS Regional Population release, capital cities collectively gained approximately 427,000 residents during the year to June 2024, while regional Australia gained approximately 125,000 (https://www.abs.gov.au/statistics/people/population/regional-population/latest-release).
- According to the ABS Total Value of Dwellings release, Australia had approximately 11.0 million residential dwellings in the December quarter of 2024.
- The Australian Government's National Housing Accord set an ambition of building 1.2 million well-located homes over five years from 1 July 2024 (https://treasury.gov.au/policy-topics/housing/accord).
- Housing Australia's State of the Nation's Housing 2024 report projected approximately 938,000 new homes over the Accord period, implying a gap of about 262,000 homes against the 1.2 million target if the projection is realised (https://www.housingaustralia.gov.au/research-data-analytics/state-nations-housing-report-2024).
| Population measure | Latest reported result | Reference period | Source |
|---|---|---|---|
| Australian population | 27.2 million | 30 June 2024 | ABS National, state and territory population |
| Annual population increase | Approximately 552,000 people | Year to 30 June 2024 | ABS National, state and territory population |
| Annual population growth rate | 2.1% | Year to 30 June 2024 | ABS National, state and territory population |
| Capital-city population increase | Approximately 427,000 people | Year to June 2024 | ABS Regional Population |
| Regional population increase | Approximately 125,000 people | Year to June 2024 | ABS Regional Population |
Sources: Australian Bureau of Statistics, National, state and territory population and Regional Population.
The projected supply gap is not a forecast that prices must rise. Prices also respond to borrowing capacity, unemployment, credit availability, taxes, buyer confidence and the volume of property offered for sale. The figures instead show that achieving the national housing target requires a construction rate above Housing Australia's central projection.
Supply also has a significant timing problem. A project may appear in planning, approval, commencement and completion datasets at different points. An approval is therefore not a completed home, and a planning target should not be reported as delivered supply.
Home Ownership, Renting and Vacancy Rates
Housing tenure has changed gradually over several decades. At the same time, low advertised rental vacancy has placed pressure on tenants in many markets. Census tenure data and monthly vacancy estimates answer different questions and should not be combined as if they measure the same population.
- According to the ABS 2021 Census QuickStats (https://www.abs.gov.au/census/find-census-data/quickstats/2021/AUS), 31.0% of occupied private dwellings were owned outright.
- The same Census found that 35.0% of occupied private dwellings were owned with a mortgage.
- According to the ABS, 30.6% of occupied private dwellings were rented at the 2021 Census.
- The Australian Institute of Health and Welfare reports that the home ownership rate declined from 70% in 1994 to 67% in 2021 (https://www.aihw.gov.au/reports/australias-welfare/home-ownership-and-housing-tenure).
- According to SQM Research's vacancy-rate series, Australia's national residential vacancy rate was 1.0% in January 2025 (https://sqmresearch.com.au/graph_vacancy.php).
- CoreLogic reported that national rents increased by 4.8% during 2024, which was the slowest calendar-year increase since 2020 (https://www.corelogic.com.au/news-research/news/2025/australian-home-values-record-first-decline-in-nearly-two-years-as-the-market-finds-a-turning-point).
| Housing tenure | Share of occupied private dwellings | Source |
|---|---|---|
| Owned outright | 31.0% | ABS 2021 Census QuickStats |
| Owned with a mortgage | 35.0% | ABS 2021 Census QuickStats |
| Rented | 30.6% | ABS 2021 Census QuickStats |
| Other tenure type | 0.8% | ABS 2021 Census QuickStats |
| Tenure not stated | 2.6% | ABS 2021 Census QuickStats |
Source: Australian Bureau of Statistics, 2021 Census QuickStats for Australia.
A vacancy rate estimates the proportion of rental stock being advertised as vacant under a provider's methodology. It is not the percentage of all homes that are empty. Definitions and collection methods vary, so comparisons should use the same series and reference period.
The tenure figures also require care. Census results classify occupied private dwellings on Census night. They are not a live measure of mortgage stress, property turnover or current rental availability. Their value lies in describing the broad structure of Australian housing tenure.
Mortgage Lending, Interest Rates and Affordability
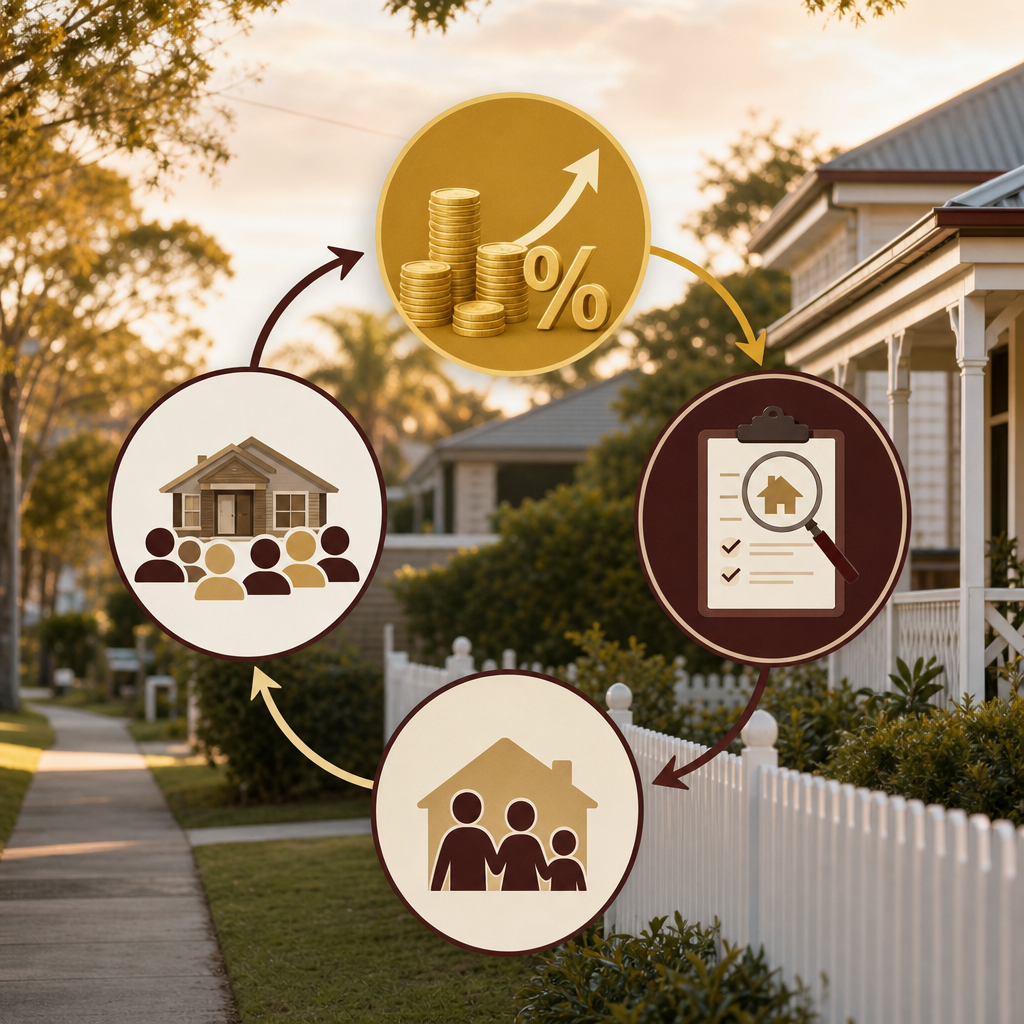
Borrowing capacity is one of the most important links between household income and property prices. Interest rates affect repayments, serviceability assessments, investor cash flow and the amount buyers can offer, but their effect can differ across market segments.
- According to the ABS Lending Indicators release, the value of new housing loan commitments was $82.8 billion in the December quarter of 2024 (https://www.abs.gov.au/statistics/economy/finance/lending-indicators/latest-release).
- The ABS reported $53.3 billion in new owner-occupier housing loan commitments during the December quarter of 2024.
- New investor housing loan commitments totalled $29.5 billion in the December quarter of 2024, according to the ABS.
- According to the Reserve Bank of Australia, the cash rate target was increased to 4.35% in November 2023 after beginning the tightening cycle at 0.10% in May 2022 (https://www.rba.gov.au/statistics/cash-rate/).
- The RBA reduced the cash rate target from 4.35% to 4.10% in February 2025, according to its monetary policy decision (https://www.rba.gov.au/media-releases/2025/mr-25-01.html).
- The RBA subsequently reduced the cash rate target to 3.85% in May 2025 (https://www.rba.gov.au/media-releases/2025/mr-25-10.html).
| Lending category | December quarter 2024 commitments | Quarterly movement | Source |
|---|---|---|---|
| Total new housing loans | $82.8 billion | -0.5% | ABS Lending Indicators |
| Owner-occupier housing loans | $53.3 billion | 1.3% | ABS Lending Indicators |
| Investor housing loans | $29.5 billion | -4.5% | ABS Lending Indicators |
Source: Australian Bureau of Statistics, Lending Indicators.
The loan commitments in this table are flows of newly approved finance during the reference quarter. They are not the total balance of outstanding Australian mortgages. They also do not show how much of the approved finance was ultimately drawn down.
Rate cuts do not produce a uniform property response. The result depends on lender pricing, assessment rates, borrower income, deposit size and the amount of housing available. Lower interest rates can increase borrowing capacity, but employment conditions and household confidence can offset or reinforce that effect.
Affordability should also be separated into at least three concepts: purchase affordability, repayment affordability and rental affordability. A dwelling may have a lower advertised price but remain difficult to purchase if deposit requirements are high. Similarly, lower mortgage rates may improve repayments without resolving the initial deposit barrier.
Investment Property Trends Australia
Investment activity affects rental supply, credit demand and transaction volumes. However, investor lending, tax records and foreign investment approvals cover different groups and reference periods.
- According to the ABS, investors accounted for $29.5 billion of the $82.8 billion in new housing loan commitments recorded during the December quarter of 2024 (https://www.abs.gov.au/statistics/economy/finance/lending-indicators/latest-release).
- Australian Taxation Office taxation statistics show that more than 2.2 million individuals reported an interest in a rental property in the 2021-22 income year (https://www.ato.gov.au/about-ato/research-and-statistics/in-detail/taxation-statistics/taxation-statistics-2021-22).
- The Foreign Investment Review Board's 2022-23 annual report recorded 5,360 residential real estate investment proposals approved during that financial year, with a combined value of $4.9 billion (https://foreigninvestment.gov.au/news-and-reports/reports-and-publications).
- According to CoreLogic, national rents increased by 4.8% during 2024, while national dwelling values increased by 4.9%. Similar headline rates do not mean every property produced the same total return because expenses, vacancies, taxes and local price movements differ.
- SQM Research recorded a national residential vacancy rate of 1.0% in January 2025, indicating that advertised rental availability remained restricted at the national level (https://sqmresearch.com.au/graph_vacancy.php).
Investor statistics should not be used to imply that every rental property is profitable. Gross rent is reduced by interest, maintenance, management, insurance, council charges, strata costs and periods without a tenant. Taxable rental income is also different from cash flow because tax rules determine when and how expenses are recognised.
Foreign investment approvals require similar caution. An approval is permission for a proposed transaction under the foreign investment framework. It is not necessarily a completed purchase, and it should not be compared directly with total established-home sales without matching definitions.
Investment property trends Australia-wide also vary by asset type. Houses may provide land exposure but require larger deposits in some markets. Apartments can offer a lower entry price, but body corporate finances, insurance, maintenance and competing supply require close examination.
Field observation on apartment-market data
The author was referred to the developer-owner of a newly built Beenleigh apartment complex in January 2021. The owner was initially sceptical that a smaller agency could achieve sales while competing with established agents. The first apartment sold in 2021, and the author's supplied business record states that 12 apartments had been sold across the complex over the following five years.
This experience is not a market benchmark and should not be extrapolated into a forecast. Its relevance is methodological. Individual apartment complexes have attributes that broad suburb medians do not capture, including body corporate records, floor plans, build quality, internal position and the amount of competing stock. Local market knowledge can explain variation around a statistical median, but it cannot replace independently verified transaction evidence.
Commercial Property Indicators
Commercial property encompasses office, industrial, logistics, retail, hotels and specialised assets. These sectors respond differently to interest rates, employment, consumer spending, lease structures and construction pipelines.
- The Property Council of Australia's Office Market Report recorded a national CBD office vacancy rate of 13.7% in January 2025 (https://www.propertycouncil.com.au/advocacy/office-market-report).
- The same Property Council reporting cycle found that non-CBD office vacancy was approximately 17.0% in January 2025.
- CBRE's Australian Industrial and Logistics Vacancy Report recorded a national industrial and logistics vacancy rate of approximately 2.5% during the second half of 2024 (https://www.cbre.com.au/insights/reports).
- According to the ABS, the value of non-residential building work is tracked separately from residential construction in the quarterly Building Activity release, reinforcing that commercial construction should not be inferred from housing approvals (https://www.abs.gov.au/statistics/industry/building-and-construction/building-activity-australia/latest-release).
Office vacancy is a physical market measure, not a direct valuation measure. Asset values also depend on effective rent, incentives, lease expiry, tenant quality, capital expenditure and the discount rate applied to future income.
Industrial vacancy data generally indicate tighter availability than office vacancy data, but the categories are not directly comparable. Industrial facilities differ in clearance height, access, power, location and development potential. Office properties differ in building grade, floorplate, environmental performance and proximity to transport.
Commercial property evidence is often less standardised than residential sales data. Private transactions may have undisclosed terms, while lease incentives can make face rents materially different from effective rents. Practitioners should therefore record the definition, geographic boundary and reporting period attached to every commercial benchmark.
Australian Market Statistics
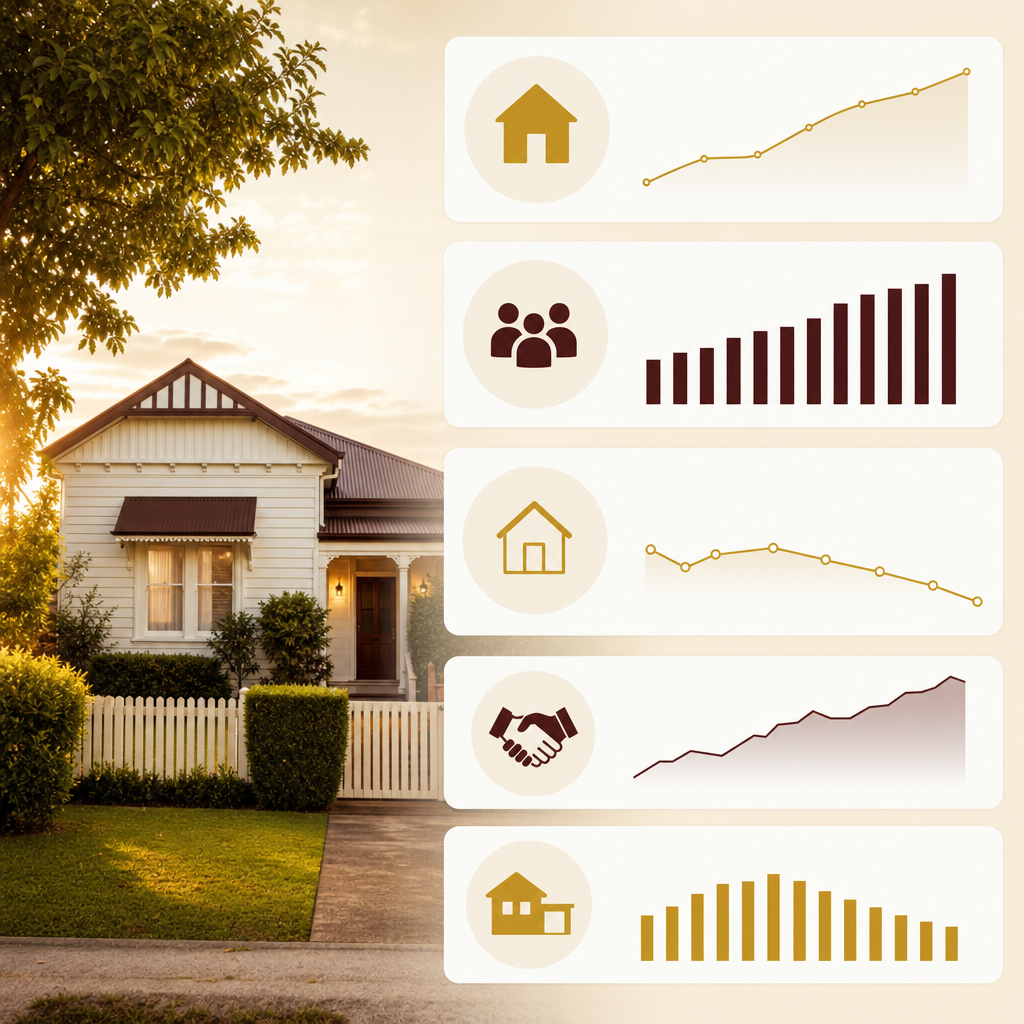
The Australian market combines a large national dwelling stock with highly localised conditions. The following indicators provide a compact view of the latest verifiable benchmarks relevant to the housing market trends Australia discussion.
| Australian market indicator | Reported figure | Reference period | Source |
|---|---|---|---|
| Total residential dwelling value | $11.0 trillion | December quarter 2024 | ABS Total Value of Dwellings |
| Residential dwelling stock | Approximately 11.0 million dwellings | December quarter 2024 | ABS Total Value of Dwellings |
| National mean dwelling price | Approximately $1.0 million | December quarter 2024 | ABS Total Value of Dwellings |
| National dwelling-value growth | 4.9% | Calendar year 2024 | CoreLogic Home Value Index |
| National advertised rental vacancy rate | 1.0% | January 2025 | SQM Research |
| Australian population | 27.2 million | 30 June 2024 | ABS Population Statistics |
| National housing target | 1.2 million homes | Five years from 1 July 2024 | Australian Treasury |
| Projected Accord-period housing delivery | Approximately 938,000 homes | Accord period | Housing Australia |
Sources: ABS Total Value of Dwellings, CoreLogic Home Value Index, SQM Research Residential Vacancy Rates, ABS National Population, Australian Treasury National Housing Accord and Housing Australia State of the Nation's Housing 2024.
Several conclusions follow from this evidence. First, dwelling values entered the current planning period at a historically large aggregate level, but annual growth was concentrated in selected capitals. Second, population growth remained strong relative to the existing dwelling stock. Third, advertised rental availability was restricted. Finally, projected housing delivery remained below the national policy target.
None of these points establishes a guaranteed direction for prices in 2026. Housing outcomes depend on the interaction between supply and effective demand. Effective demand is constrained by income, deposits, credit policy and borrowing costs, rather than population alone.
State taxes and regulations also differ. Stamp duty, land tax, tenancy law and first-home buyer assistance can change transaction costs and holding expenses. National statistics should consequently be supplemented with state and local evidence before a decision is made.
Australian Property Market Outlook for 2026
A credible Australian property market outlook should use scenarios rather than a single precise national forecast. The evidence supports several factors to monitor.
Interest rates and credit: RBA decisions influence mortgage pricing, but lender competition and serviceability rules determine how policy changes reach borrowers. According to the RBA, the cash rate moved from 4.35% to 4.10% in February 2025 and then to 3.85% in May 2025. Historical rate changes should not be presented as a promise about later decisions.
Construction delivery: The government's 1.2 million-home ambition and Housing Australia's projected delivery of about 938,000 homes provide a measurable policy gap. The gap could narrow or widen as approvals, commencements, labour availability and project feasibility change.
Population distribution: The ABS recorded national population growth of 2.1% in the year to June 2024. The distribution of that growth matters more to individual markets than the national total. Demand effects will differ between established capitals, outer growth areas and regional centres.
Rental availability: SQM Research's national vacancy rate of 1.0% in January 2025 indicates restricted advertised supply. Future rental conditions will depend on dwelling completions, household formation, migration and investor participation.
Market divergence: CoreLogic's 2024 results ranged from a 19.1% increase in Perth to a 3.0% decline in Melbourne. This spread demonstrates that a single national forecast can conceal materially different local cycles.
For research purposes, a 2026 forecast should be updated when new information becomes available. At minimum, analysts should monitor the same price index each month, quarterly lending commitments, population releases, rental vacancies and housing completions. Switching providers without noting the methodological change can create a false trend.
Key Takeaways
- Separate national direction from local performance. CoreLogic's 2024 capital-city results show that Australian markets can move in different directions during the same year.
- Distinguish forecasts from recorded data. The National Housing Accord target is an ambition, while Housing Australia's estimate is a projection rather than delivered supply.
- Keep index methodology consistent. CoreLogic and PropTrack both found national growth during 2024, but their reported rates differed because their datasets and methods are not identical.
- Analyse finance alongside price. ABS lending commitments and RBA cash-rate decisions help explain effective purchasing capacity, but neither measure guarantees future price movements.
- Treat low rental vacancy as one input rather than a complete investment case. Expenses, property condition, local supply and tenant demand remain property-specific.
- Use commercial benchmarks within their sector. Office vacancy cannot be compared directly with industrial vacancy without accounting for different asset characteristics.
- Record the reference period for every statistic. Census tenure data, monthly vacancies and quarterly lending figures describe different periods and populations.
- Verify local evidence before relying on a property forecast Australia-wide. Comparable sales, listings, rents, planning changes and building condition can be more relevant to an individual property than a national average.
Methodology and Disclaimer
This article aggregates publicly available statistics and industry research relevant to real estate market trends Australia-wide. Sources were selected on the basis of institutional authority, identifiable methodology and public accessibility. Government sources were prioritised for population, tenure, lending, housing policy and aggregate dwelling data. Private research providers were used for more frequent price, rent and vacancy indicators.
The latest available evidence does not always share the same reference date. Census tenure statistics relate to 2021, while several price and lending indicators relate to 2024 or 2025. These figures remain useful for 2026 planning when their dates are clearly disclosed, but they are not live measures of current conditions.
Figures may be revised by their publishers. Rounded totals may not reconcile exactly, and percentages may differ because of seasonal adjustment, index methodology, geographic coverage or subsequent revisions. Forecasts are identified as projections or targets and are not treated as recorded outcomes.
The supplied Beenleigh field observation is included as qualitative first-hand context. It is not represented as an independent study, a controlled case comparison or a general performance benchmark. No testimonial has been included because no verifiable testimonial material was supplied.
Statistics sourced from publicly available research and industry reports. Verify individual figures before publishing. This article provides general information only and does not constitute property, legal, taxation, lending or financial advice. Readers requiring administrative contact information can refer to the published contact details.
Sources
- Australian Bureau of Statistics, Total Value of Dwellings: https://www.abs.gov.au/statistics/economy/price-indexes-and-inflation/total-value-dwellings/latest-release
- Australian Bureau of Statistics, National, state and territory population: https://www.abs.gov.au/statistics/people/population/national-state-and-territory-population/latest-release
- Australian Bureau of Statistics, Regional Population: https://www.abs.gov.au/statistics/people/population/regional-population/latest-release
- Australian Bureau of Statistics, 2021 Census QuickStats for Australia: https://www.abs.gov.au/census/find-census-data/quickstats/2021/AUS
- Australian Bureau of Statistics, Lending Indicators: https://www.abs.gov.au/statistics/economy/finance/lending-indicators/latest-release
- Australian Bureau of Statistics, Building Activity, Australia: https://www.abs.gov.au/statistics/industry/building-and-construction/building-activity-australia/latest-release
- CoreLogic, Australian home values record first decline in nearly two years: https://www.corelogic.com.au/news-research/news/2025/australian-home-values-record-first-decline-in-nearly-two-years-as-the-market-finds-a-turning-point
- PropTrack, Home Price Index: https://www.proptrack.com.au/insights-hub/home-price-index/
- Reserve Bank of Australia, Cash Rate Target: https://www.rba.gov.au/statistics/cash-rate/
- Reserve Bank of Australia, Monetary Policy Decision, February 2025: https://www.rba.gov.au/media-releases/2025/mr-25-01.html
- Reserve Bank of Australia, Monetary Policy Decision, May 2025: https://www.rba.gov.au/media-releases/2025/mr-25-10.html
- Housing Australia, State of the Nation's Housing 2024: https://www.housingaustralia.gov.au/research-data-analytics/state-nations-housing-report-2024
- Australian Treasury, National Housing Accord: https://treasury.gov.au/policy-topics/housing/accord
- SQM Research, Residential Vacancy Rates: https://sqmresearch.com.au/graph_vacancy.php
- Australian Institute of Health and Welfare, Home ownership and housing tenure: https://www.aihw.gov.au/reports/australias-welfare/home-ownership-and-housing-tenure
- Australian Taxation Office, Taxation statistics 2021-22: https://www.ato.gov.au/about-ato/research-and-statistics/in-detail/taxation-statistics/taxation-statistics-2021-22
- Foreign Investment Review Board, Reports and publications: https://foreigninvestment.gov.au/news-and-reports/reports-and-publications
- Property Council of Australia, Office Market Report: https://www.propertycouncil.com.au/advocacy/office-market-report
- CBRE Australia, Research and reports: https://www.cbre.com.au/insights/reports
Get tailored guidance
Send us your question and we will reply within one business day.
Send us the article topic, suburb, or property goal you want help with and we will reply within one business day.
Send my questionFAQ
What are the main real estate market trends in Australia for 2026?
The main factors are uneven capital-city performance, restricted rental availability, population growth, changing borrowing costs and a projected housing supply shortfall.
Will Australian property prices rise in 2026?
No national outcome can be stated with certainty. Prices depend on interest rates, employment, credit access, population, listings and construction, and individual markets may move differently.
Which Australian capital city recorded the strongest growth in 2024?
According to CoreLogic, Perth recorded the strongest capital-city dwelling-value growth during 2024 at 19.1%.
Is Australia building enough homes to meet its housing target?
Housing Australia projected approximately 938,000 homes over the Accord period, compared with the Australian Government target of 1.2 million homes.
What was Australia's national rental vacancy rate?
According to SQM Research, Australia's national residential vacancy rate was 1.0% in January 2025.
How should investors use Australian property statistics?
Investors should compare consistent datasets, check reference dates and supplement national indicators with local sales, rents, vacancies, expenses and planning information.
Margy George
Property and finance guidance from the George & Sons team.
Keep reading
property management fees Australia
Property Management Fees in Australia: A Comprehensive Guide for Landlords
19 min read
rent vesting strategy australia
Rent-Vesting in Australia: The Strategic Property Investor's Guide for 2026
18 min read
increasing rent without losing tenants
Increasing Rent Without Losing Tenants: A Guide for Australian Investors
16 min read
Ready for clarity?
Get a calm, practical plan for your next property move.
Buying, selling, finance, or renting - tell us what you are working on and we will come back with the most useful next step.
Tell us what you need help with.
Send a quick enquiry and the team will come back with a clear next step.
Request a callback